Analysis · Collector Crypt
Every pack advertises a profit. Every pack pays about 95¢.
Collector Crypt publishes its pull rates, its value bands, and its own expected value for every gacha machine — more disclosure than most of this category offers, and they deserve credit for it. Those published numbers say each pack contains more value than it costs. They also say, once you read the buyback rate printed next to them, that selling your pull back returns roughly 94%–95% of what you paid.
Both statements come from the same panel on their own site. Neither is our estimate. Figures below were read from the live interface on .
The finding. Across a 100× price range — a $50.00 pack to a $5,000.00 pack — the expected loss on the buyback exit stays between 4.87% and 6.26%. The headline EV falls as packs get pricier, and the buyback rate rises to meet it. The two move in opposite directions and land in almost the same place every time.
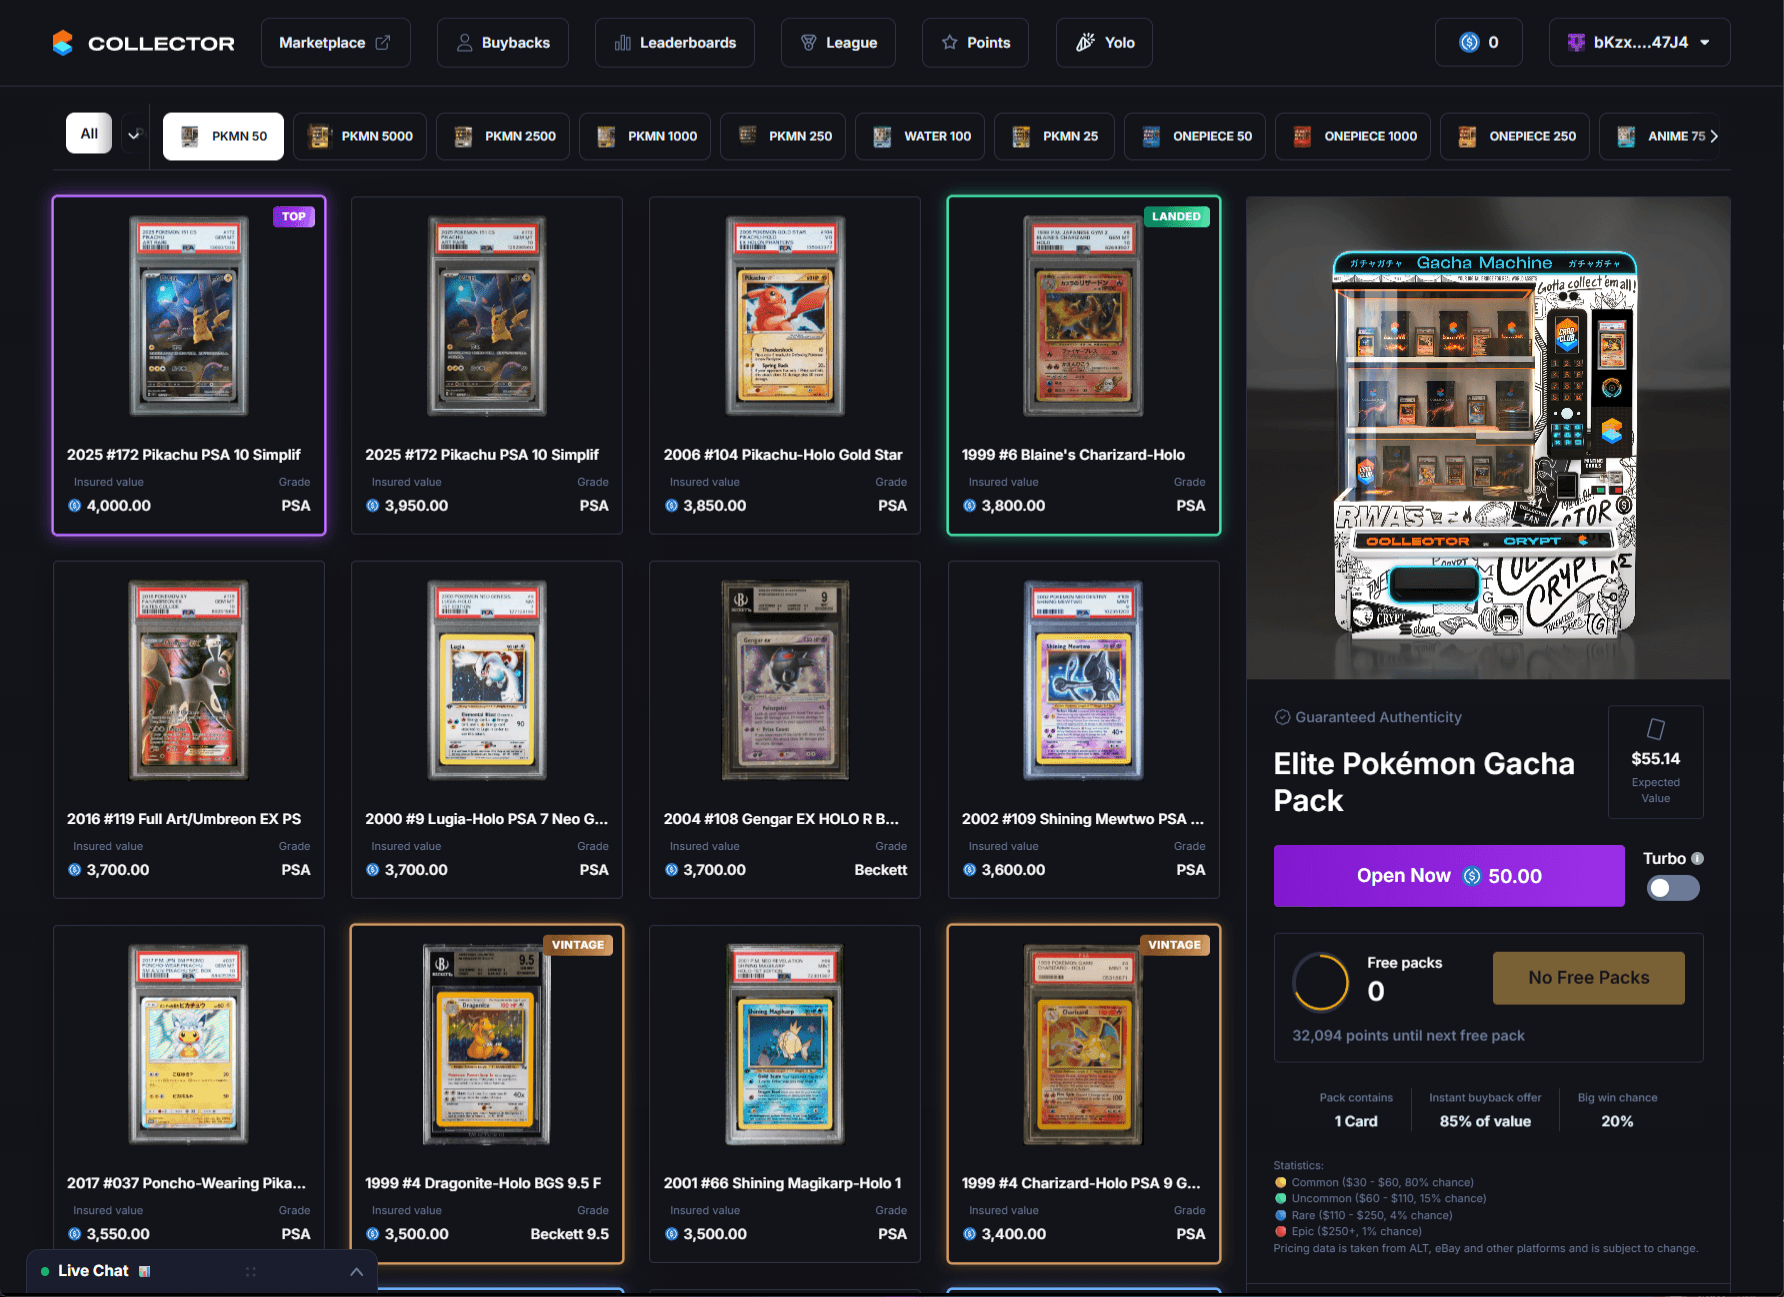
The four Pokémon machines, as published
| Machine | Price | Their stated EV | Per $1 | Buyback | Per $1 after buyback |
|---|---|---|---|---|---|
| Elite Pokémon Gacha Pack | $50.00 | $55.14 | 1.103 | 85% | 0.937 |
| Water Pack | $100.00 | $105.70 | 1.057 | 90% | 0.951 |
| Legendary Pokémon Gacha Pack | $250.00 | $263.23 | 1.053 | 90% | 0.948 |
| One Piece Emperor Pack | $1,000.00 | $1,018.87 | 1.019 | 93% | 0.948 |
| Mythic Pokémon Gacha Pack | $2,500.00 | $2,553.14 | 1.021 | 93% | 0.950 |
| Celestial Pokémon Gacha Pack | $5,000.00 | $5,092.77 | 1.019 | 93% | 0.947 |
Price, stated EV and buyback rate are Collector Crypt’s own published figures, read 2026-08-04. The two “per $1” columns are those figures divided by the pack price and multiplied by the buyback rate — arithmetic on published numbers, not modelling.
Read the last two columns together. The $50.00 pack advertises 1.103 of value per dollar — the most generous headline on the board — and pairs it with the worst buyback at 85%. The $250.00 pack advertises the least, at 1.053, and pairs it with the best buyback at 90%. After both adjustments the gap between them is under a penny and a half on the dollar.
Why 75–80% of rips lose before the buyback is even applied
The published value bands explain the shape. On every machine, the most likely outcome by a wide margin is a card whose band starts at half to six-tenths of the pack price.
| Machine | Common | Uncommon | Rare | Epic |
|---|---|---|---|---|
| $50.00 | 80%$30.00–$60.00 | 15%$60.00–$110.00 | 4%$110.00–$250.00 | 1%$250.00+ |
| $100.00 | 75%$50.00–$100.00 | 20%$100.00–$200.00 | 4%$200.00–$500.00 | 1%$500.00+ |
| $250.00 | 75%$150.00–$250.00 | 20%$250.00–$400.00 | 4%$400.00–$2,000.00 | 1%$2,000.00+ |
| $1,000.00 | 75%$600.00–$1,000.00 | 20%$1,000.00–$1,600.00 | 4%$1,600.00–$8,000.00 | 1%$8,000.00+ |
| $2,500.00 | 75%$1,250.00–$2,500.00 | 20%$2,500.00–$5,000.00 | 4%$5,000.00–$10,000.00 | 1%$10,000.00+ |
| $5,000.00 | 75%$2,500.00–$5,000.00 | 20%$5,000.00–$10,000.00 | 4%$10,000.00–$20,000.00 | 1%$20,000.00+ |
On the three larger machines the common band tops out exactly at the pack price, which means a common can never be a win — the best possible common is break-even before fees, and a loss after the buyback haircut. Only the $50.00machine’s common band runs above its price, to $60.00, so the very top of its common range is the one profitable common on the board.
Collector Crypt states this themselves, in a manner of speaking: the “big win chance” shown next to each machine — 20% on the $50.00 pack, 25% on the others — is exactly the sum of every tier above common. It is, near enough, their own published probability that you come out ahead.
A note on their expected-value figure
Their stated EV is lower than the bands alone would suggest. Take the midpoint of each published band on the $50.00 machine and the arithmetic lands near $56.00 before the open-ended Epic tier is counted at all — above the $55.14 they publish.
That gap is informative rather than suspicious. It means the real distribution inside each band sits below the midpoint — more cards near the floor of a band than the ceiling — which is what you would expect and what a naive midpoint calculation would get wrong. It is also why we use their stated EV for the headline rather than recomputing from the bands: the bands are ranges, so any EV we derived from them would be an estimate, and their figure is not.
Pricing data is taken from ALT, eBay and other platforms and is subject to change. That sourcing matters: an EV built on marketplace comps moves when those comps move, so these figures are a snapshot of 2026-08-04 rather than a fixed property of the packs.
The limit of this analysis
Everything above takes Collector Crypt’s stated expected value at face value. That is a published figure, so it is not our estimate — but it is a figure about their valuation of the cards, not an independently checked market price.
We have since found, on a different platform, a card in a guaranteed-value pool listed at roughly 70% above what independent sales data suggests it trades for. One card on one site is not a pattern, and we are not naming it until we have checked more. But it establishes that stated card values in this category can be materially wrong.
So treat 93.7–95.1¢ per dollar as a ceiling rather than a midpoint. If a platform’s valuations skew high, the real return is worse than this — never better. The direction of that error is knowable even when its size isn’t, and we would rather tell you which way our own number can be wrong. Why this affects every EV figure in the category.
The buyback is not the only exit
Everything above assumes you take the instant buyback, because that is the exit the platform puts in front of you and the one whose rate they publish. There are two others, and they have different arithmetic.
- Sell on the open market. Recovers more than 85% of value if you can find a buyer, at the cost of fees, time, and effort. Whether it beats the buyback depends on the spread you can actually achieve, not the one you hope for.
- Redeem the physical card. Keeps the full value but costs shipping, and import tax where you live. We have first-hand quotes for what that costs — and a break-even table showing the card value at which shipping beats selling back. Note the direction of that trade: the better buyback on the pricier machines makes redemption less attractive, not more.
What this is not
This is not an accusation. There is no evidence here of misstated odds, and nothing about a house edge is improper — every operator has one, and Collector Crypt publishes the components of theirs openly enough that anyone can do this arithmetic. Publishing pull rates, value bands, an expected value, and a buyback rate on the same panel is more than most of this category manages.
The point is narrower and worth stating plainly: the advertised expected value and the amount you can actually walk away with are different numbers, and only one of them is printed in large type. The edge does not live in the draw. It lives in the spread between what a card is worth and what the platform will pay you for it.
Published figures read from the live interface 2026-08-04 · manual snapshot pending API access · we re-check and say what changed